Scatter
Scatter plot.
Scatter
Bases: _AxisChart
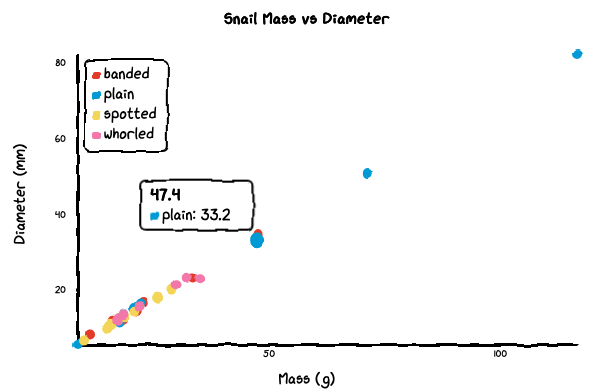
Scatter plot with numeric or temporal x-axis.
Unlike other axis charts, Scatter does not use a labels array. Each
dataset contains {x, y} points directly. Adding an r field to
any point activates bubble mode: dot radii are scaled by r using a
square-root scale so area encodes magnitude.
Parameters:
| Name | Type | Description | Default |
|---|---|---|---|
title
|
str | None
|
Chart title. |
None
|
x_label
|
str | None
|
Label for the x-axis. |
None
|
y_label
|
str | None
|
Label for the y-axis. |
None
|
datasets
|
Any
|
List of dataset dicts, each with |
required |
options
|
Any
|
Dict of chart options. |
None
|
Options:
backgroundColor(str): Background color (default'white').dataColors(list[str]): Point/line colors.dotSize(float): Base dot size multiplier (default 1).fontFamily(str): Font family (default'xkcd').legendPosition(int): Legend placement (usepositionType).showLegend(bool): Show legend (default True).showLine(bool): Connect dots with lines (default False).strokeColor(str): Axis/border color (default'black').timeFormat(str): dayjs format string for temporal x-axis.unxkcdify(bool): Disable hand-drawn style (default False).xMin(float): Minimum x-axis value.xMax(float): Maximum x-axis value.xRef(list[dict]): Vertical reference lines. Each entry is{"value": <number>, "label": <annotation-text>}.xTickCount(int): Number of x-axis ticks (default 3).yMin(float): Minimum y-axis value.yMax(float): Maximum y-axis value.yRef(list[dict]): Horizontal reference lines. Each entry is{"value": <number>, "label": <annotation-text>}.yTickCount(int): Number of y-axis ticks (default 3).
Example — scatter with reference lines::
Scatter(
    title="Scatter",
    x_label="X",
    y_label="Y",
    datasets=[{
        "label": "Series A",
        "data": [{"x": 1, "y": 2}, {"x": 3, "y": 5}],
    }],
    options={
        "yRef": [{"value": 3.5, "label": "median"}],
    },
)
Example — bubble chart::
Scatter(
    title="Bubbles",
    datasets=[{
        "label": "Population",
        "data": [
            {"x": 1, "y": 2, "r": 10},
            {"x": 3, "y": 5, "r": 30},
        ],
    }],
)
Source code in src/chart_xkcd/scatter.py
7 8 9 10 11 12 13 14 15 16 17 18 19 20 21 22 23 24 25 26 27 28 29 30 31 32 33 34 35 36 37 38 39 40 41 42 43 44 45 46 47 48 49 50 51 52 53 54 55 56 57 58 59 60 61 62 63 64 65 66 67 68 69 70 71 72 73 74 75 76 77 78 79 80 81 82 83 84 85 86 87 88 89 90 91 92 93 94 95 96 97 98 99 100 | |