Pie
Pie chart.
Pie
Bases: _BaseChart
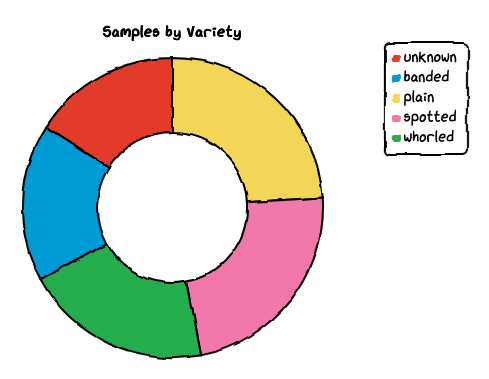
Pie/donut chart.
Uses a single dataset. Only datasets[0] is rendered.
Parameters:
| Name | Type | Description | Default |
|---|---|---|---|
title
|
str | None
|
Chart title. |
None
|
labels
|
Any
|
Slice labels. |
required |
datasets
|
Any
|
List containing one dataset dict with a |
required |
options
|
Any
|
Dict of chart options. |
None
|
Options:
backgroundColor(str): Background color (default'white').dataColors(list[str]): Slice colors.fontFamily(str): Font family (default'xkcd').innerRadius(float): 0 for pie, 0.5 for donut (default 0.5).legendPosition(int): Legend placement (usepositionType).showLegend(bool): Show legend (default True).strokeColor(str): Border color (default'black').unxkcdify(bool): Disable hand-drawn style (default False).
Example:
Pie(
    title="Browser Share",
    labels=["Chrome", "Firefox", "Safari"],
    datasets=[{"data": [60, 20, 20]}],
    options={"innerRadius": 0.5},
)
Source code in src/chart_xkcd/pie.py
7 8 9 10 11 12 13 14 15 16 17 18 19 20 21 22 23 24 25 26 27 28 29 30 31 32 33 34 35 36 37 38 39 40 41 42 43 44 45 46 47 48 49 50 51 52 | |