Radar
Radar chart.
Radar
Bases: _BaseChart
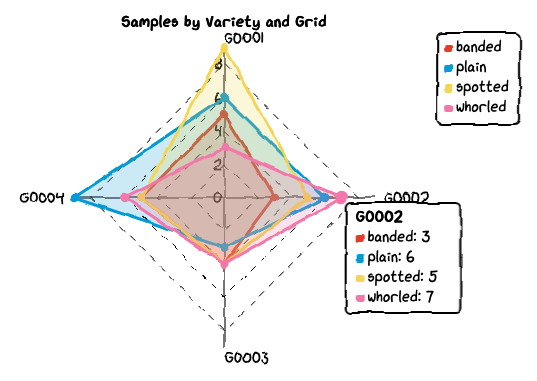
Radar/spider chart for multi-dimensional data.
Each label defines an axis radiating from the center. Multiple datasets are rendered as overlapping polygons.
Parameters:
| Name | Type | Description | Default |
|---|---|---|---|
title
|
str | None
|
Chart title. |
None
|
labels
|
Any
|
Axis labels (dimension names). |
required |
datasets
|
Any
|
List of dataset dicts, each with |
required |
options
|
Any
|
Dict of chart options. |
None
|
Options:
backgroundColor(str): Background color (default'white').dataColors(list[str]): Dataset colors.dotSize(float): Point size multiplier (default 1).fontFamily(str): Font family (default'xkcd').legendPosition(int): Legend placement (usepositionType).showLabels(bool): Show axis labels (default False).showLegend(bool): Show legend (default False).strokeColor(str): Grid/border color (default'black').ticksCount(int): Number of grid rings (default 3).unxkcdify(bool): Disable hand-drawn style (default False).
Example:
Radar(
    title="Skills",
    labels=["JavaScript", "Python", "Go", "Rust", "SQL"],
    datasets=[
        {"data": [8, 9, 5, 3, 7], "label": "Developer A"},
        {"data": [6, 7, 8, 6, 5], "label": "Developer B"},
    ],
    options={"showLabels": True, "showLegend": True},
)
Source code in src/chart_xkcd/radar.py
7 8 9 10 11 12 13 14 15 16 17 18 19 20 21 22 23 24 25 26 27 28 29 30 31 32 33 34 35 36 37 38 39 40 41 42 43 44 45 46 47 48 49 50 51 52 53 54 55 56 57 58 59 | |