Home
chart.xkcd
A Python + JavaScript library for creating xkcd-style charts. See this repository for the original code.
Examples
Python command-line examples (examples/*.py)
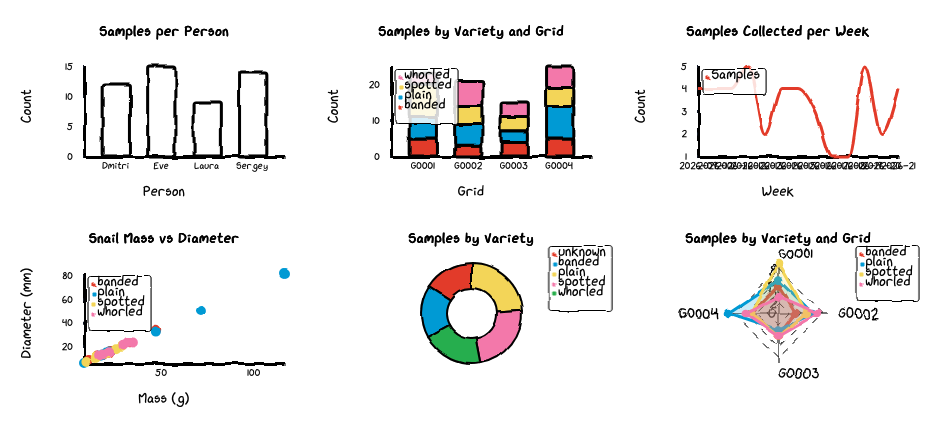
Each chart type has a standalone script that reads a CSV file and writes a static HTML page:
| Script | Chart type | Input CSV | Description |
|---|---|---|---|
bar.py |
Bar | tmp/bar.csv |
Samples per person |
stacked_bar.py |
StackedBar | tmp/stacked_bar.csv |
Samples by variety and grid |
line.py |
Line | tmp/line.csv |
Samples collected per week |
scatter.py |
Scatter | tmp/scatter.csv |
Snail mass vs diameter |
pie.py |
Pie | tmp/pie.csv |
Samples by variety |
radar.py |
Radar | tmp/radar.csv |
Samples by variety and grid |
Run them all at once with:
task ex_py
Or run one individually:
python examples/bar.py tmp/bar.csv tmp/bar.html
Marimo notebook (examples/notebook.py)
A marimo notebook that displays all six chart types as interactive
widgets. Each cell reads a CSV file from tmp/ and calls to_widget()
to render the chart.
marimo run examples/notebook.py
Selection test notebook (examples/test_selection.py)
A marimo notebook demonstrating click, shift-click, and box-select
interactions. Each chart is wrapped with mo.ui.anywidget() so that
selection changes trigger reactive cell updates.
marimo run examples/test_selection.py
JavaScript examples (js/examples/)
A standalone HTML page (example.html) that renders all six chart
types using the JavaScript library directly. The data is loaded
dynamically from CSV files via fetch(). A symlink
js/examples/tmp points to the project-level tmp/ directory.
To view the JavaScript examples with a dev server:
task ex_js
Then open the URL printed by the dev server in a browser.
Project structure
assets/                  xkcd-script.ttf font file
bin/                     build scripts (font_encode.py)
examples/                Python examples, SQL queries, marimo notebooks
js/src/                  JavaScript chart source
  Bar.js, Line.js, ...   chart classes
  config.js              shared constants
  widget.js              anywidget entry point
  index.js               standalone library entry point
  components/Tooltip.js  tooltip component
  utils/                 shared helpers (axes, labels, legend, font, filter)
pages/                   MkDocs documentation files
  pages/img/             screenshots of charts
src/chart_xkcd/          Python package
  bar.py, line.py, ...   chart classes
  charts.py              base classes and validation
  widget.py              anywidget adapter (ChartWidget, to_widget)
  renderer.py            HTML rendering (render, to_html)
  config.py              positionType constants
  main.py                CLI entry point
  static/                bundled JS (built artifact)
docs-requirements.txt    ReadTheDocs dependencies
mkdocs.yml               MkDocs configuration file
pyproject.toml           Python project file