Line
Line chart.
Line
Bases: _AxisChart
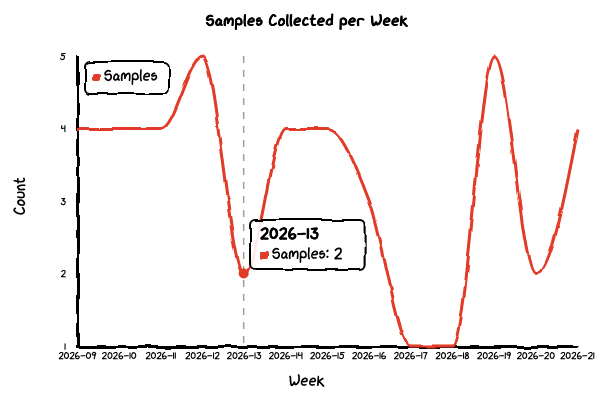
Line chart for continuous data with one or more lines.
Parameters:
| Name | Type | Description | Default |
|---|---|---|---|
title
|
str | None
|
Chart title. |
None
|
x_label
|
str | None
|
Label for the x-axis. |
None
|
y_label
|
str | None
|
Label for the y-axis. |
None
|
labels
|
Any
|
X-axis category labels. |
required |
datasets
|
Any
|
List of dataset dicts, each with |
required |
options
|
Any
|
Dict of chart options. |
None
|
Options:
backgroundColor(str): Background color (default'white').dataColors(list[str]): Line colors.fontFamily(str): Font family (default'xkcd').legendPosition(int): Legend placement (usepositionType).showArea(bool): Fill the area under each line (default False).showLegend(bool): Show legend (default True).strokeColor(str): Axis/border color (default'black').unxkcdify(bool): Disable hand-drawn style (default False).xRef(list[dict]): Vertical reference lines. Each entry is{"value": <x-label>, "label": <annotation-text>}.yRef(list[dict]): Horizontal reference lines. Each entry is{"value": <number>, "label": <annotation-text>}.yMin(float): Minimum y-axis value.yMax(float): Maximum y-axis value.yTickCount(int): Number of y-axis ticks (default 3).
Example::
Line(
    title="Temperature",
    x_label="Day",
    y_label="Degrees",
    labels=["Mon", "Tue", "Wed", "Thu"],
    datasets=[
        {"data": [65, 70, 68, 72], "label": "NYC"},
        {"data": [80, 82, 79, 85], "label": "LA"},
    ],
    options={
        "showArea": True,
        "yRef": [{"value": 75, "label": "target"}],
    },
)
Source code in src/chart_xkcd/line.py
7 8 9 10 11 12 13 14 15 16 17 18 19 20 21 22 23 24 25 26 27 28 29 30 31 32 33 34 35 36 37 38 39 40 41 42 43 44 45 46 47 48 49 50 51 52 53 54 55 56 57 58 59 60 61 62 63 64 65 66 67 68 69 | |